Network graphs are helpful tools that researchers can use to convey meaning between information connections. According to authors Ruth Ahnert, Sebastian E. Ahnert, Catherine Nicole Coleman, and Scott B. Weingart, in their book The Network Turn: Changing Perspectives in the Humanities (2020), “The conventional network graph of node and edge (points connected by lines) makes it possible to convey a tremendous amount of information all at once, in one view. Networks express an internal logic of relationships between entities that is inherently intuitive.” (The Network Turn 57). The connections shown through these graphs can give researchers information about the material they are studying.
Many projects have used network graphs to help better understand, gain meaning, and answer questions about the material they are graphing. One such project includes Viral Texts. In this project, researchers, including Ryan Cordell, examined nineteenth-century American newspapers and their connections. What they found with these newspapers recirculated many articles, making the researchers wonder why. They found the answers to many of the different questions posed by the different types of recirculated texts related to the culture during the Antebellum period in the United States. Mapping the Republic of Letters is another project that used network graphs similar to Viral Texts. Like in the Viral Texts project, the Mapping the Republic of Letters project used network graphs overlaid on a map to show connections between letters from historical figures. From these connections and the use of a map, researchers discovered the importance of travel and that the letters were a way “of communicating ideas and shaping opinion, and also as a process of intellectual self-definition.” (“Historical Research in a Digital Age” 407-9). Another project that uses network graphs is Linked Jazz. Linked Jazz, like the other two projects, uses these graphs to show connections with the researchers’ material, in this case different jazz musicians. What the researchers discovered was “data about concert performances and recording dates gives . . . rich information about not just collaborations between musicians, but also about time and place, musical works, songs, and songwriters, and record labels and releases . . . .” (Hwang, Levay, and Provo “Contributing to Linked Jazz” 2015). Network graphs can show the connections between material and convey meaning about a time, place, people, or even a genre of music.
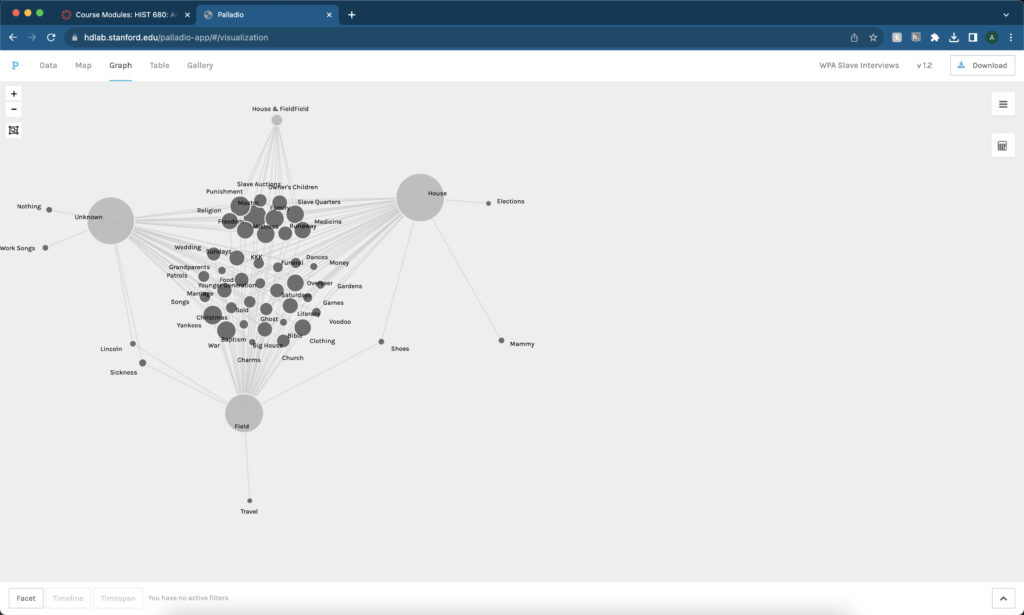
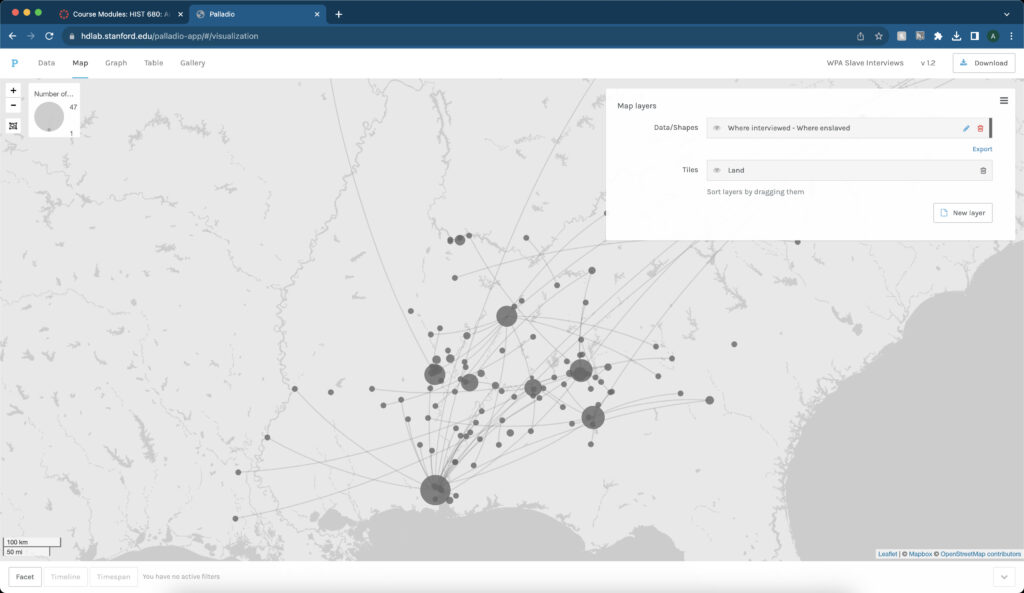
I discovered much information and meaning from using these tools when starting with Palladio and network graphs. A simple network graph overlaid on a map shows the connections across the space. It gave me a scope of how and where these connections happened.
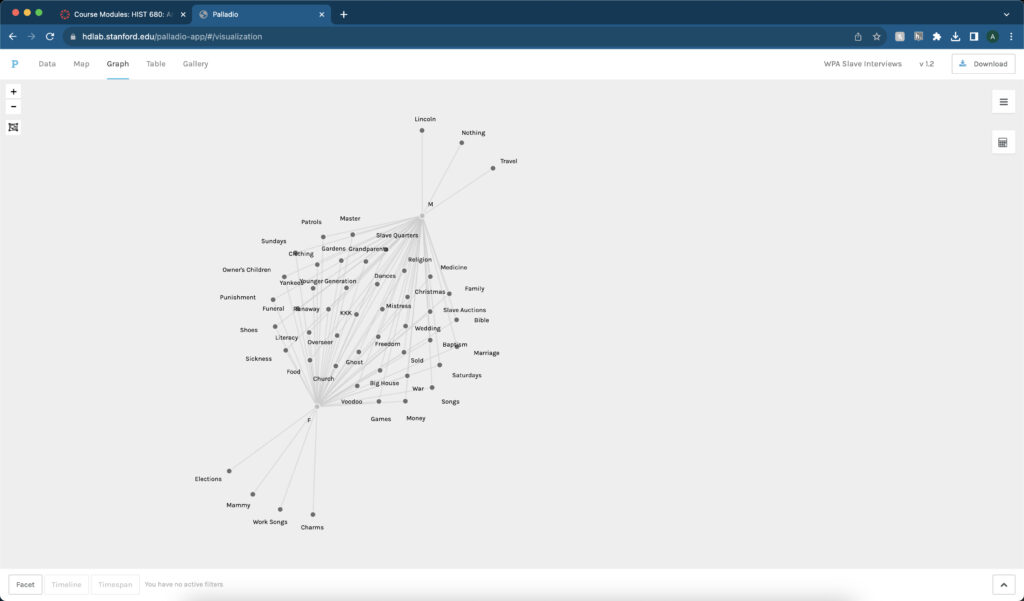
I then started playing around with the network graphs and limiting certain information to see what I could find. One such graph shows the topics that male and female interviewees discussed. While they shared many of the topics, some were limited to either only male or only female interviewees. Using that information, I gathered that those topics were important to that gender specifically for a reason. For example, only female interviewees discussed elections which made me think about how they did not get the right to vote like their male counterparts which is probably why that topic is important to them.
Another graph shows the topics categorized based on their job. Again the topic of elections stood out to me since it was limited to only people who worked in the house. It led me to think that perhaps it was because they heard more gossip and politics from their masters while working in the house.